Have election turnouts been falling?
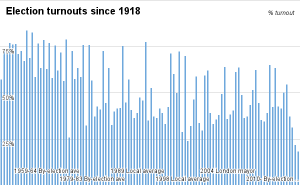
After appallingly poor turnouts in recent local elections in the UK The Guardian has a post implying that election turnouts have been falling over time. The key figure is this:

They also have a chart showing that smaller, less nationally important elections get a far lower turnout. Given that their time series data combines all election types, I was curious about how the time series broke down by category.
The first thing to note is that local elections (with lower average turnout) are far more prevalent in recent years, at least in The Guardian’s data. That immediately means that the overall trend will show a decline in turnout, even if turnout within categories hasn’t declined.
Looking at turnout within the major categories gives this:
All of those series could be stationary, save for the by-elections, which show a pretty clear downward trend. The outliers in the local election data are probably just an artifact of the aggregation up to a ‘local’ category.
What I take from this is that trend to lower turnout in the Guardian’s chart is generated largely by the increasing prevalence of local elections, rather than any systematic decline in voter turnout. The interesting question is why voter turnout would be lower when elections are more local. Perhaps some political scientists can help out on that front?
HT: Will Tanner

