A new beginning

I’m sure you’ve all noticed that, with the exception of Patrick’s great post on productivity yesterday, it’s been a bit quiet around here lately. Matt’s busy working two jobs in addition to writing a PhD, agnitio has decided that a house and family are more important than blogging, and I have descended into the laziness of failing to test my ideas in public. One of those things is a really bad reason not to blog, so my Christmas present to myself is to get back in the saddle and spend at least one day a week being told off by Eric! But I want to write about some different things than I did previously.
Read more

Living below the line

Hey all.  Instead of writing about anything you might be interested in, I’m going to use this forum to ask for donations for the living below the line challenge next week – with the funds going to Aoteraroa Development Cooperative.  The justification I’ve been using when asking people is below.

I just received an email reminding me I’m doing the Living Below the Line thing this week, where I just have to spend less than $2.25 per day on food next week – and so I need to fund-raise.

The charity my funds are being donated too is Aotearoa Development Cooperative, which is a small microfinance bank that has been set up in Myanmar. If you want to support them by giving me money here, that would be pretty cool.

If anyone is up to giving a couple of dollars to a good cause that would be choice.

What econs do

Recently on twitter I decided to write a bunch of acronyms.  In my defence I noted:

Now a couple of points were left unsaid here.  What is the other 65% and how did I get my data.

The other 65% falls into three categories.  15% is made up of using esoteric terms to describe often obvious social phenomenon.  Another 10% is made up of using metaphors as a way of communicating these esoteric terms.  And the final 40% is mentioning data points.

The data set used to decompose what economists do into these categories is an unbalanced panel from the last 7 years.  Given selection bias in my sample and the fuzziness of quantifying what fits into certain categories I used a bit of calibration (to fit the data to known population parameters), smoothing, hedonic adjustment, and judgement to adjust the data.

In other terms I made it up.

Proper posts will be back soon – I have been working on posts about NZ election policies.  They won’t be that detailed, but hopefully they will be of interest.

Woops

I have just accidentally purchased 6 books on methodology, mostly economics but one from sociology and one general philosophy of science book.  As I’m supposed to be estimating a whole lot of things at the moment, this combined with these new books may leave me a little quiet …

Hopefully I can get up from my slumber to write about the election during the weekend (and have the posts go up over the week).  But if it doesn’t happen, here is the excuse.  I’m time inconsistent and my best precommitment mechanism was to not buy the books – and it failed me.

Note:  One of the books appears to be premised on the idea that economics is returning to sociology, and that eventually they’ll combined into the same discipline (called sociology).  This isn’t the sociology book – this is one of the philosophy of economics books which I purchased under a bundle of “economic methodology books”.  I will report back once I’ve read it – there is a different one I want to read first, to see if it is a better introductory book than a few others I already own (specifically this fellow I learnt from – with a pdf version appearing here it seems).

I love introductory books, even in areas where I have read a bit of the literature, as the people who can communicate the ideas most clearly are often those that understand it most deeply.  Not always, but often.

Help! Census confusion

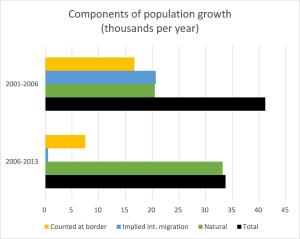
I have been trying to figure out the latest census figures, especially for sources of population growth. Does anyone know what I am doing wrong?

I calculated the change in population using the post enumeration survey. I counted up the births and deaths from the vital statistics from Infoshare. The difference should be international net migration. In the 2001-2006 period there was a difference, but a small one.

In the latest census, the gap is really quite large. Implied net migration is around 500 people per year, compared to the data that is normally used for international migration (7,500 per year).

Does anyone know why the difference is suddenly so large? Or what I am doing wrong?

Also, sorry I have been missing in action from the blog. Work has been crazy and I was writing this book to, um, agitate people.

Population growth - between censuses

Can we justify the Easter trading laws?

Back in April, Benje Patterson decided to have a think about whether the Easter trading laws really made sense (Infometrics link).  His view was that:

Having so far failed in my search for a reasonable justification for restricting Easter trading in New Zealand, my mind then turned to a more consumer-orientated motivation that transcends religion and worker welfare.  Perhaps I am the odd one out and the majority of society want the shops to be closed at Easter simply because it allows them to enjoy a quiet day, free of temptations to hit the shops and consume.

Is this the only fair justification – and is it a reasonable justification in of itself?